Periodically, researchers try innovations in order to emphasize certain aspects of the textual data. One such example is the stemma given by G. Mink in his article recently quoted by Nazaroo in discussing commentaries. Our interest is however in Mink's innovative stemma, (diagram 17) shown below:
 | |||
| Click on this to Enlarge: Backbutton to return |
At once, it should be realized that the solid and dotted lines are not simply two alternate genealogical trees. Each individual manuscript could have acquired readings from more than one source independently. This means that the diagram encompasses ALL combinatorical possibilities, and this involves many hundreds of variations as to the actual transmission of readings. Its not just two stemmas. Mink has in a relatively simple and intuitive way shown all the most likely possibilities (1st and 2nd order) by which the extant manuscripts could have come to contain their texts.
He still uses vertical position to indicate manuscript date (and therefore has avoided the question of age of text vs. date of MS.).
Other useful innovations are possible. In the following diagram, mixture (cross-copying of readings) is indicated in contrast to genealogical relationship (where the majority of the text was copied from).
 | |
| Click to Enlarge: Backbutton to return. |
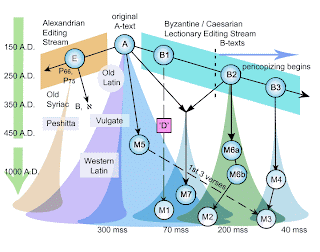
Nowadays, it is acknowledged that manuscript relations are not as sharp as simple lines. To show dependence and mixture of text-types as opposed to single manuscripts, something more realistic and representative of "flows and streams" of transmission is given below:
 | |
| Click to Enlarge |
Much can be learned from various solutions to displaying human genealogies. The important relations between individuals need to be retained in detailed family trees, and such methods give us ideas for similar problems with manuscripts. In the following diagram, secondary texts, alternate readings, and the spread of influence can be placed inside boxes using symbols and color-codes if desired:
Where generational information is available, it may be more desirable to display that than manuscript ages:
Sometimes, genealogical dependence is unknown at the start of an investigation. What is needed is to plot affinity or closeness of relation, without presuming dependence per se. Such diagrams, while not 'true stemma', in that they don't indicate direction of dependence, can help to sort and solve relationships when coupled with other data. Two such forms are as follows:
In one diagram, size of node indicates importance, while in the other, the connection is stressed, and its strength is indicated by thickness or style of line.
When many manuscripts are to be displayed and they are not closely related, and many others are missing from the stream, so that no real accurate stemmas are possible, a different method of display is preferable, as in the following diagram:
In other cases, genealogical connections are possible, but mixture may be as strong as genealogical dependence, and so it can be shown with similar lines:
In some situations, alternate routes of dependence are more important than spread of texts, and these details can be highlighted and elaborated with colors and symbols, as in the diagrams below;
In many cases, the earlier manuscripts are missing, and only the later copies survive. Here genealogical relations must be deduced by working backward from extant MSS to the proposed source-structures:
When groupings need to emphasized, another style of display can be used:
Color-coding can be effectively used to indicate groupings, and a more natural, organic display will illustrate the connections nicely:
Since the mass of manuscripts are quite late copies, a realistic understanding of the circumstances can help immensely in capturing the essence of things:
Above all, a look at the many options that are available can greatly stimulate both analysis and articulation/communication of data effectively.
Keep trying various methods, to see what is effective for your data, and someday your genealogical stemmas will be as nice as ours:
mr.scrivener


No comments:
Post a Comment